

See the air chain the way the signal travels.
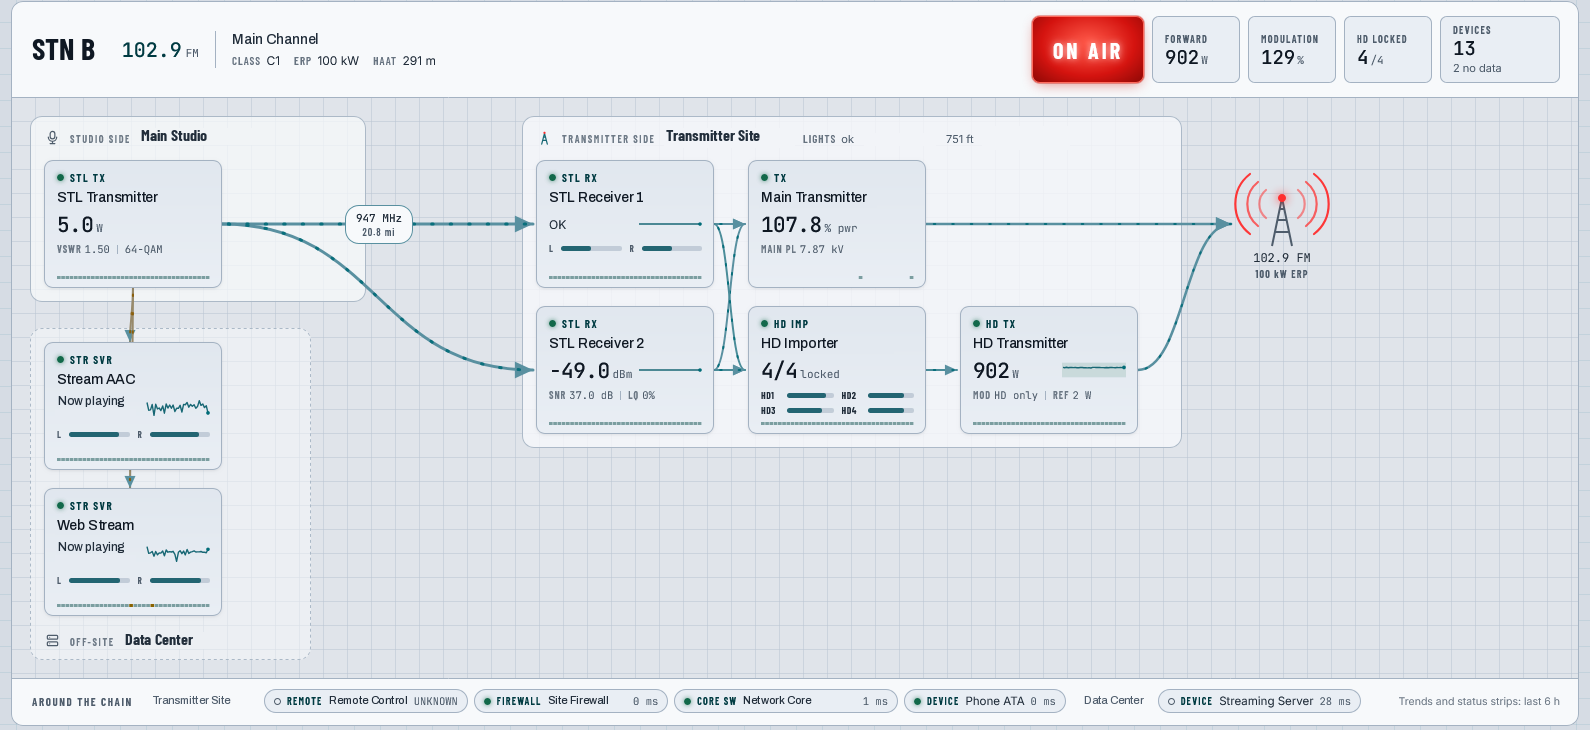
A list of devices tells you something is wrong. Air Chain View tells you where. Every station is drawn as its real path — studio, STL hop, transmitter site, tower — with each box live on that path, so the moment something drops you can see exactly where the chain went quiet.
Your whole market, chain by chain.
Stations stack down the dashboard grouped by market, each one a self-contained picture of its own air chain. Scroll it like a wall of monitors — it refreshes itself, and nothing you are not looking at goes unwatched.
Left to right, studio to tower.
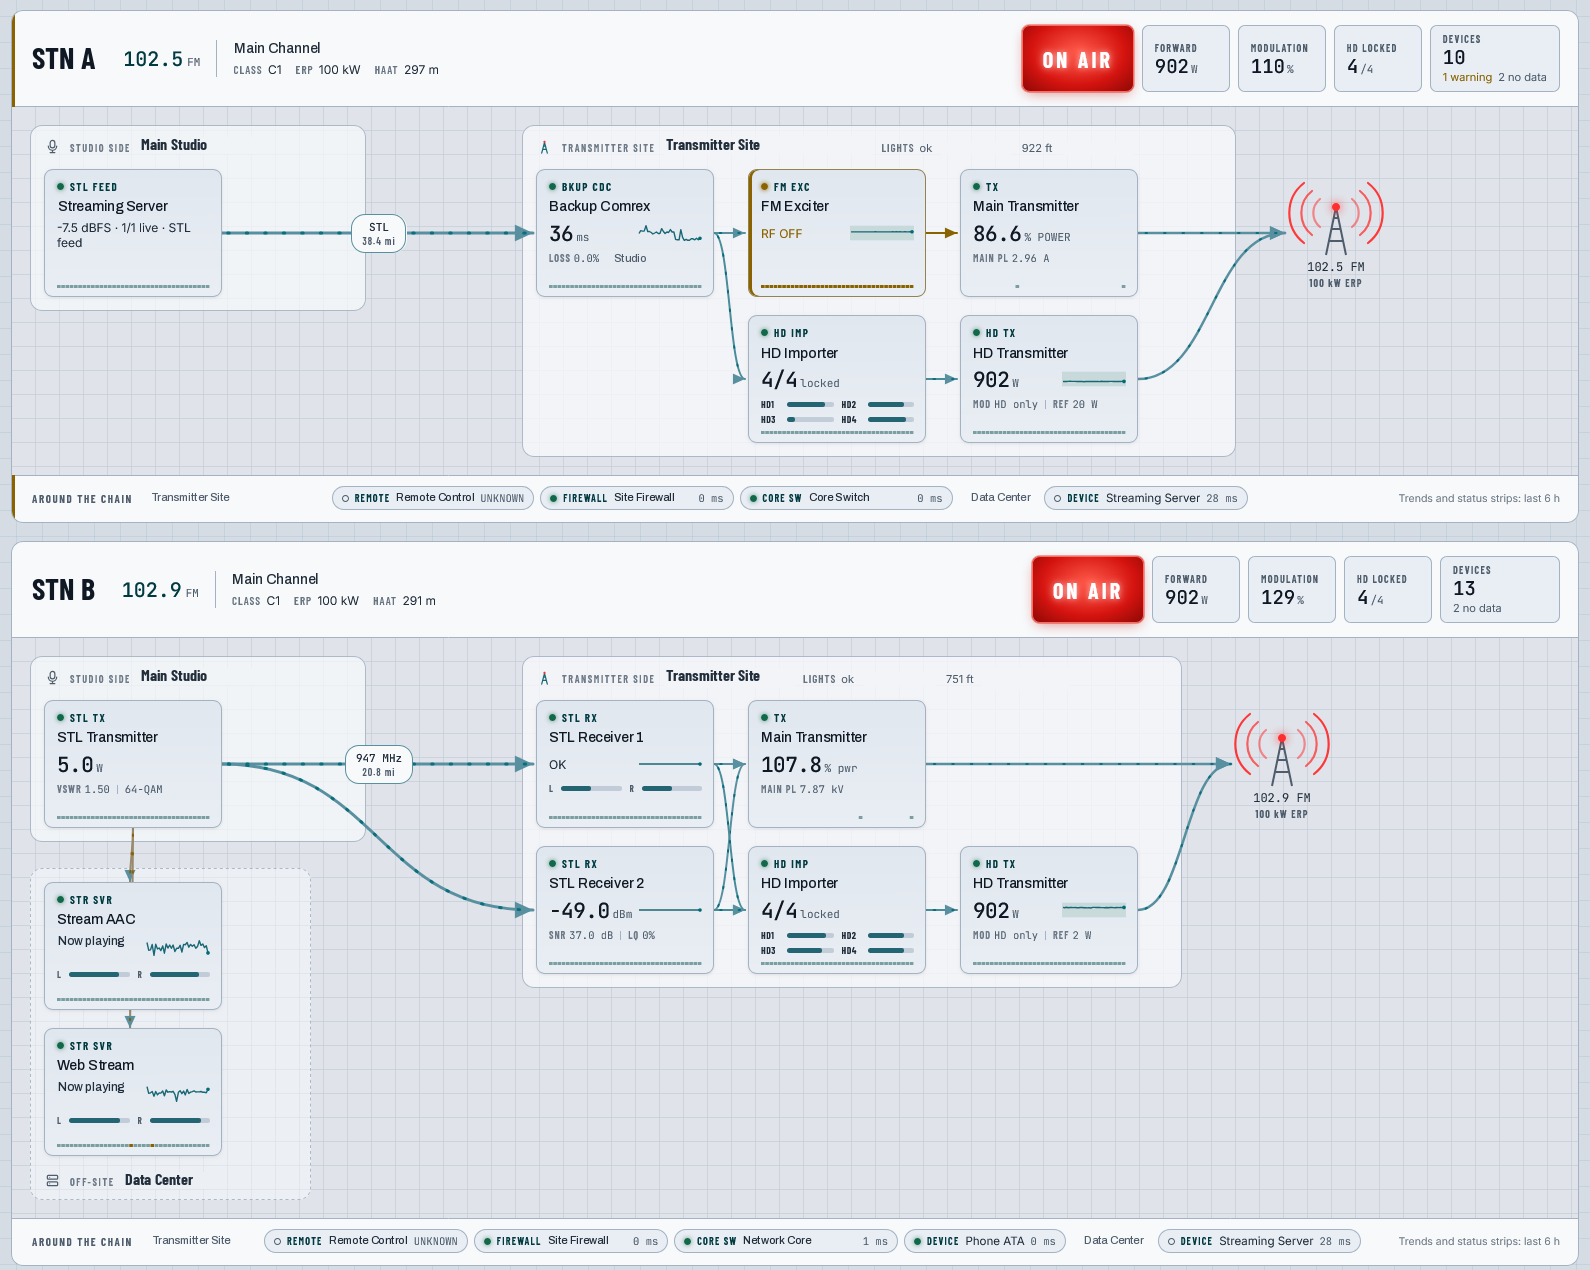
Every chain reads the same way, so an engineer who has never seen the station can find the fault in seconds.
Studio side
Where the program leaves the building — STL feeds, encoders and stream servers, each tile showing its live level and a short trend line.
The STL hop
The link between buildings is drawn as a link, with its label right on the line — the path, its frequency and its distance.
Transmitter site
Receivers, HD importer, exciter and transmitter in signal order, each with its reading — power, level, lock — where you would expect to find it.
The tower
Every chain ends at the antenna, marked with the frequency and effective radiated power the station puts on the air.
Backup paths
A backup codec or a standby transmitter sits on its own branch, so you can see what is carrying air and what is waiting for its turn.
Nothing quietly disappears
A box that stops answering stays on the chain, marked stale with the time of its last poll — the gap is the first thing you see, not the last.
The answer is in the header.
Before you read a single tile, the station header tells you whether you are on the air and how well.
- ✓On air — one status for the whole station, not for any single box
- ✓Forward power and modulation for the station, live
- ✓HD lock across every HD channel, shown as how many of them are locked
- ✓Device count, with warnings and anything not reporting called out beside it
- ✓The licence — class, ERP, height and city of licence — and for a translator, the station it rebroadcasts
The gear that keeps the chain alive, right underneath it.
Remote controls, firewalls, core switches, phone adapters and streaming servers do not carry the audio, but lose one and the chain goes down anyway. They sit in a strip under each station with their response time, next to the site they live at.
Trends built in
Every tile carries a trend and status strip covering the last six hours, so a reading drifting the wrong way shows up before it trips an alarm.
Grouped by market
Stations are grouped by market with a count of how many are in each, so each market reads as one block.
Your view, your default
Switch views from the dashboard’s View menu and set the one you want to open on — by station, or the full signal chain.
Nothing left out
A device you have not placed in a chain yet is still polled and still alerts. It waits under Unassigned Devices until you attach it on its device page.
See your own chains on one screen.
Tell us what is in your racks and how your stations are fed. We will draw your chains, point them at your gear and show you the view your engineers will open every morning.